JPEG Glitching
JPEG decompression relies on a table of values stored in the file when the image was compressed. So what happens if we modify that table?
Theory
There are mistakes and lies in here.
If you just want to glitch some JPEGs you can skip down to "Glitching the coefficient table". You don't need to know all the theory but it's interesting and might be useful. Writing out the theory just helped me understand the process better so I decided to put it online. Leaving out explanations and simplifying steps makes everything look cleaner but means you can't trust what you read. There are multiple 8 x 8 tables of values involved in compressing a JPEG which can get confusing. To help, I've named each table something unique in the steps below. These aren't official names in any sense although some might be close.
We start the JPEG compression process with 1) an image, and 2) an 8 x 8 tables of values called the coefficient table.
- RGB image data is translated to YCbCr. Ie, luminance (brightness) and chrominance (colour) information
- YCbCr data is divided into 8 pixel by 8 pixel squares - we'll call these chunks
- For each chunk a new 8 by 8 table of values is calculated - we'll call these lumps. This step is the most complicated and most important to understand so I've expanded it below under the heading DCT
- The values in each lump are divided by the values from the coefficient table then rounded to the nearest integer
- The final results are then compressed using Huffman coding (mentioned because it's very interesting but not relevant to what we're doing)
DCT
In step 3 above a mysterious calculation was performed on the chunk data to create the DCT tables. The calculation involves yet another 8 x 8 table, which I'll call the DCT table. Each element in the DCT table is itself another 8 x 8 table which I'll call waveblocks. Take a moment to look at this picture of the DCT table:
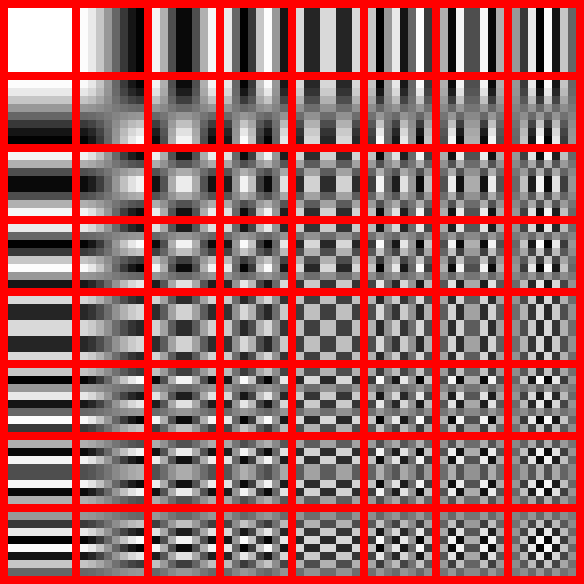
Each red bordered section is a "waveblock". For now just focus on the top row. Each waveblock shows a cosine wave with the peaks coloured white and the troughs coloured black. From left to right the frequency of the wave increases resulting in more and more stripes.
If you look at the left most column you'll see the same pattern as you go downwards, except the wave is now vertical instead of horizontal. From there you should be able to see how the remaining waveblocks are just combining the values from the topmost and leftmost waveblocks:
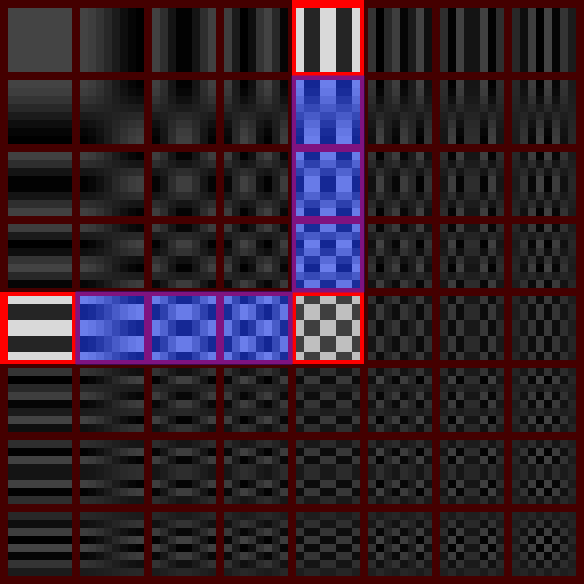
The magic part of JPEG compression works by looking at each "chunk" (ie, an 8x8 section of pixels from the original image - see step 2 in the process above) and working out how to create something approximating that chunk using waveblocks. The values from all 64 waveblocks are added together but each with a different strength. For example, in a chunk where every pixel is the same colour all waveblocks except the one in the top left of the DCT table will have a strength of zero.
The strength value of each waveblock is then stored in an 8x8 grid to create a "lump" (one of my totally made up names - see step 3 in the process above). The same process is repeated for each chunk until we have a corresponding lump for each.
Coefficient Table
Looking at the DCT table you can see that the waveblocks get more detailed the closer you get to the bottom right. Fine, high contrast details at that scale aren't very common in images - here's a 128 by 128 checkerboard to show how pointless that would be:

So the strength values for waveblocks starts high in the upper left and becomes weaker as we move towards the bottom right. The numbers start getting so low that they might as well be zero, which is where the coefficient table appears. In step 4 of the process above you can see that the values in each lump are divided by matching values in the coefficient table. The values in the coefficient table increase as we move towards the bottom right so we end up with top left values being mostly untouched but dropping off sharply towards the bottom right. The coefficient table is manually created to specify just how fast the drop off is.
JPEG quality sliders in image editing software are really a list of coefficient tables. A high quality table has all slots filled with the value 1, so the values in the lump are unchanged. A low quality coefficient table might have all values high except the top left so only the top left waveblock has any effect on the lump.
To make sure the JPEG can be decompressed the coefficient table is included in the file.
Glitching the coefficient table
Here's the meaty stuff, the purpose of this page. If you haven't guessed already we'll be finding the coefficient table in a JPEG and changing the values. Different coefficient values will mean waveblocks in the DCT table will be applied to the final image with a different strength than when they were originally calculated.
First, you have to find the table in the JPEG file. Because the file format is well designed and defined that's easy (provided you're comfortable editing hex data). Pick a JPEG file and open it in the hex editor of your choice.
If you haven't played with hex data before then try HxD. Open the file like you would in any other program then press CTRL + F to open the Find function. Note that we'll be searching for hexadecimal data, so switch to the Find function's "Hex-values" tab before proceeding.
Pieces of meta information in a JPEG file are marked with two bytes each. The first is always FF and the second notes what the meta information is - we're looking for the marker pair FF DB. You'll start to notice some of my lies and omissions now - a JPEG file has more than one coefficient table so the marker will show up at least twice.
Directly after the FF DB marker will be two bytes noting whether there's a single table marked or a double table. If you see 00 43 then there's a single table of 64 values. 00 84 is less common and marks a double table with 128 values. After the table size bytes should be an empty byte that can be ignored. You'll now be looking at a set of 64 (or 128) bytes that you can start editing.
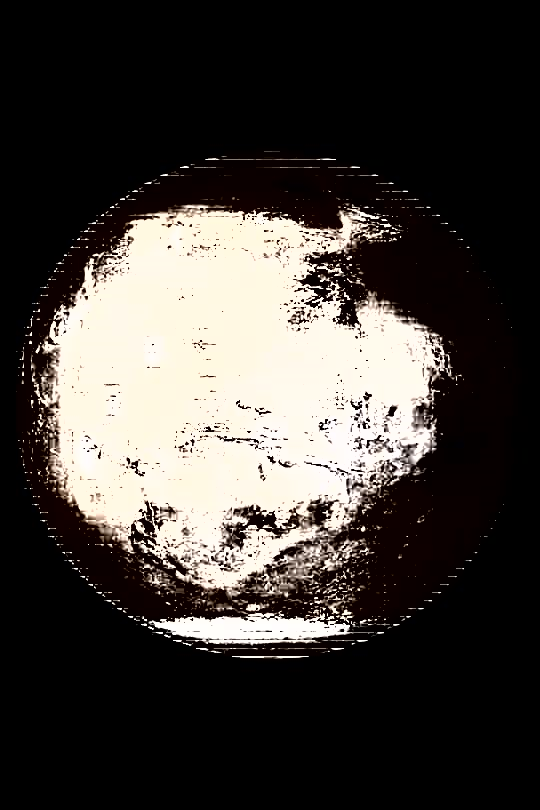
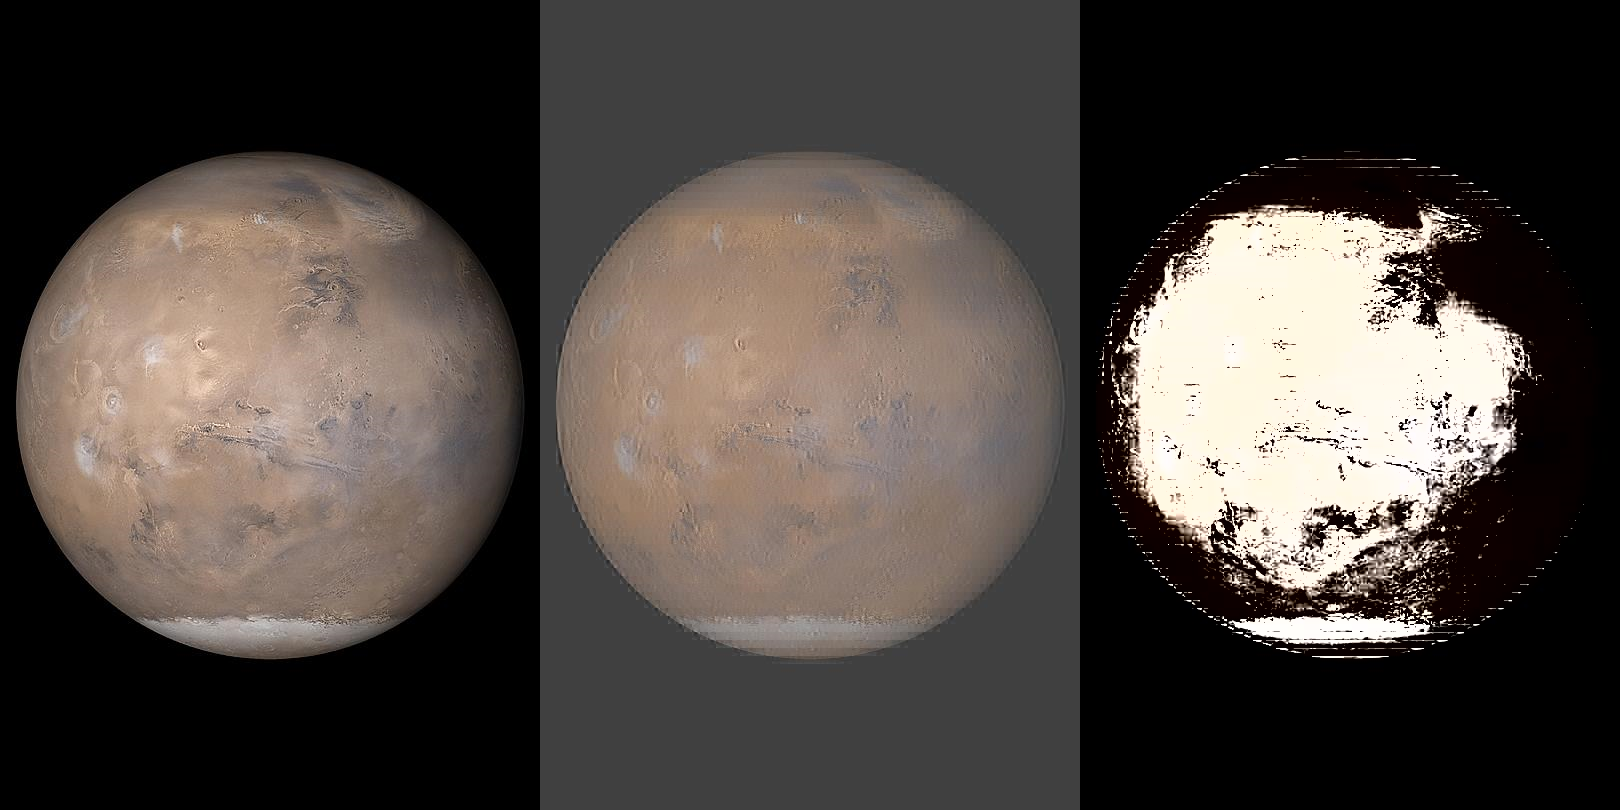
Congrats! All the hard stuff is done! Now you just type in whatever 64 (or 128) bytes of data you want. If you want a subtle effect you'll want to start with low numbers and gradually increase to higher numbers like a real coefficient table. The example picture below was made by copying values from an existing coefficient table I found at ImpulseAdventure.
For a more intense effect you can either put in an "inverted" coefficient table (ie, start with high numbers and end with low numbers) or simply type random values. For the example below I just mashed my keyboard until I had enough data entered.